Data Visualisation Framework
Description
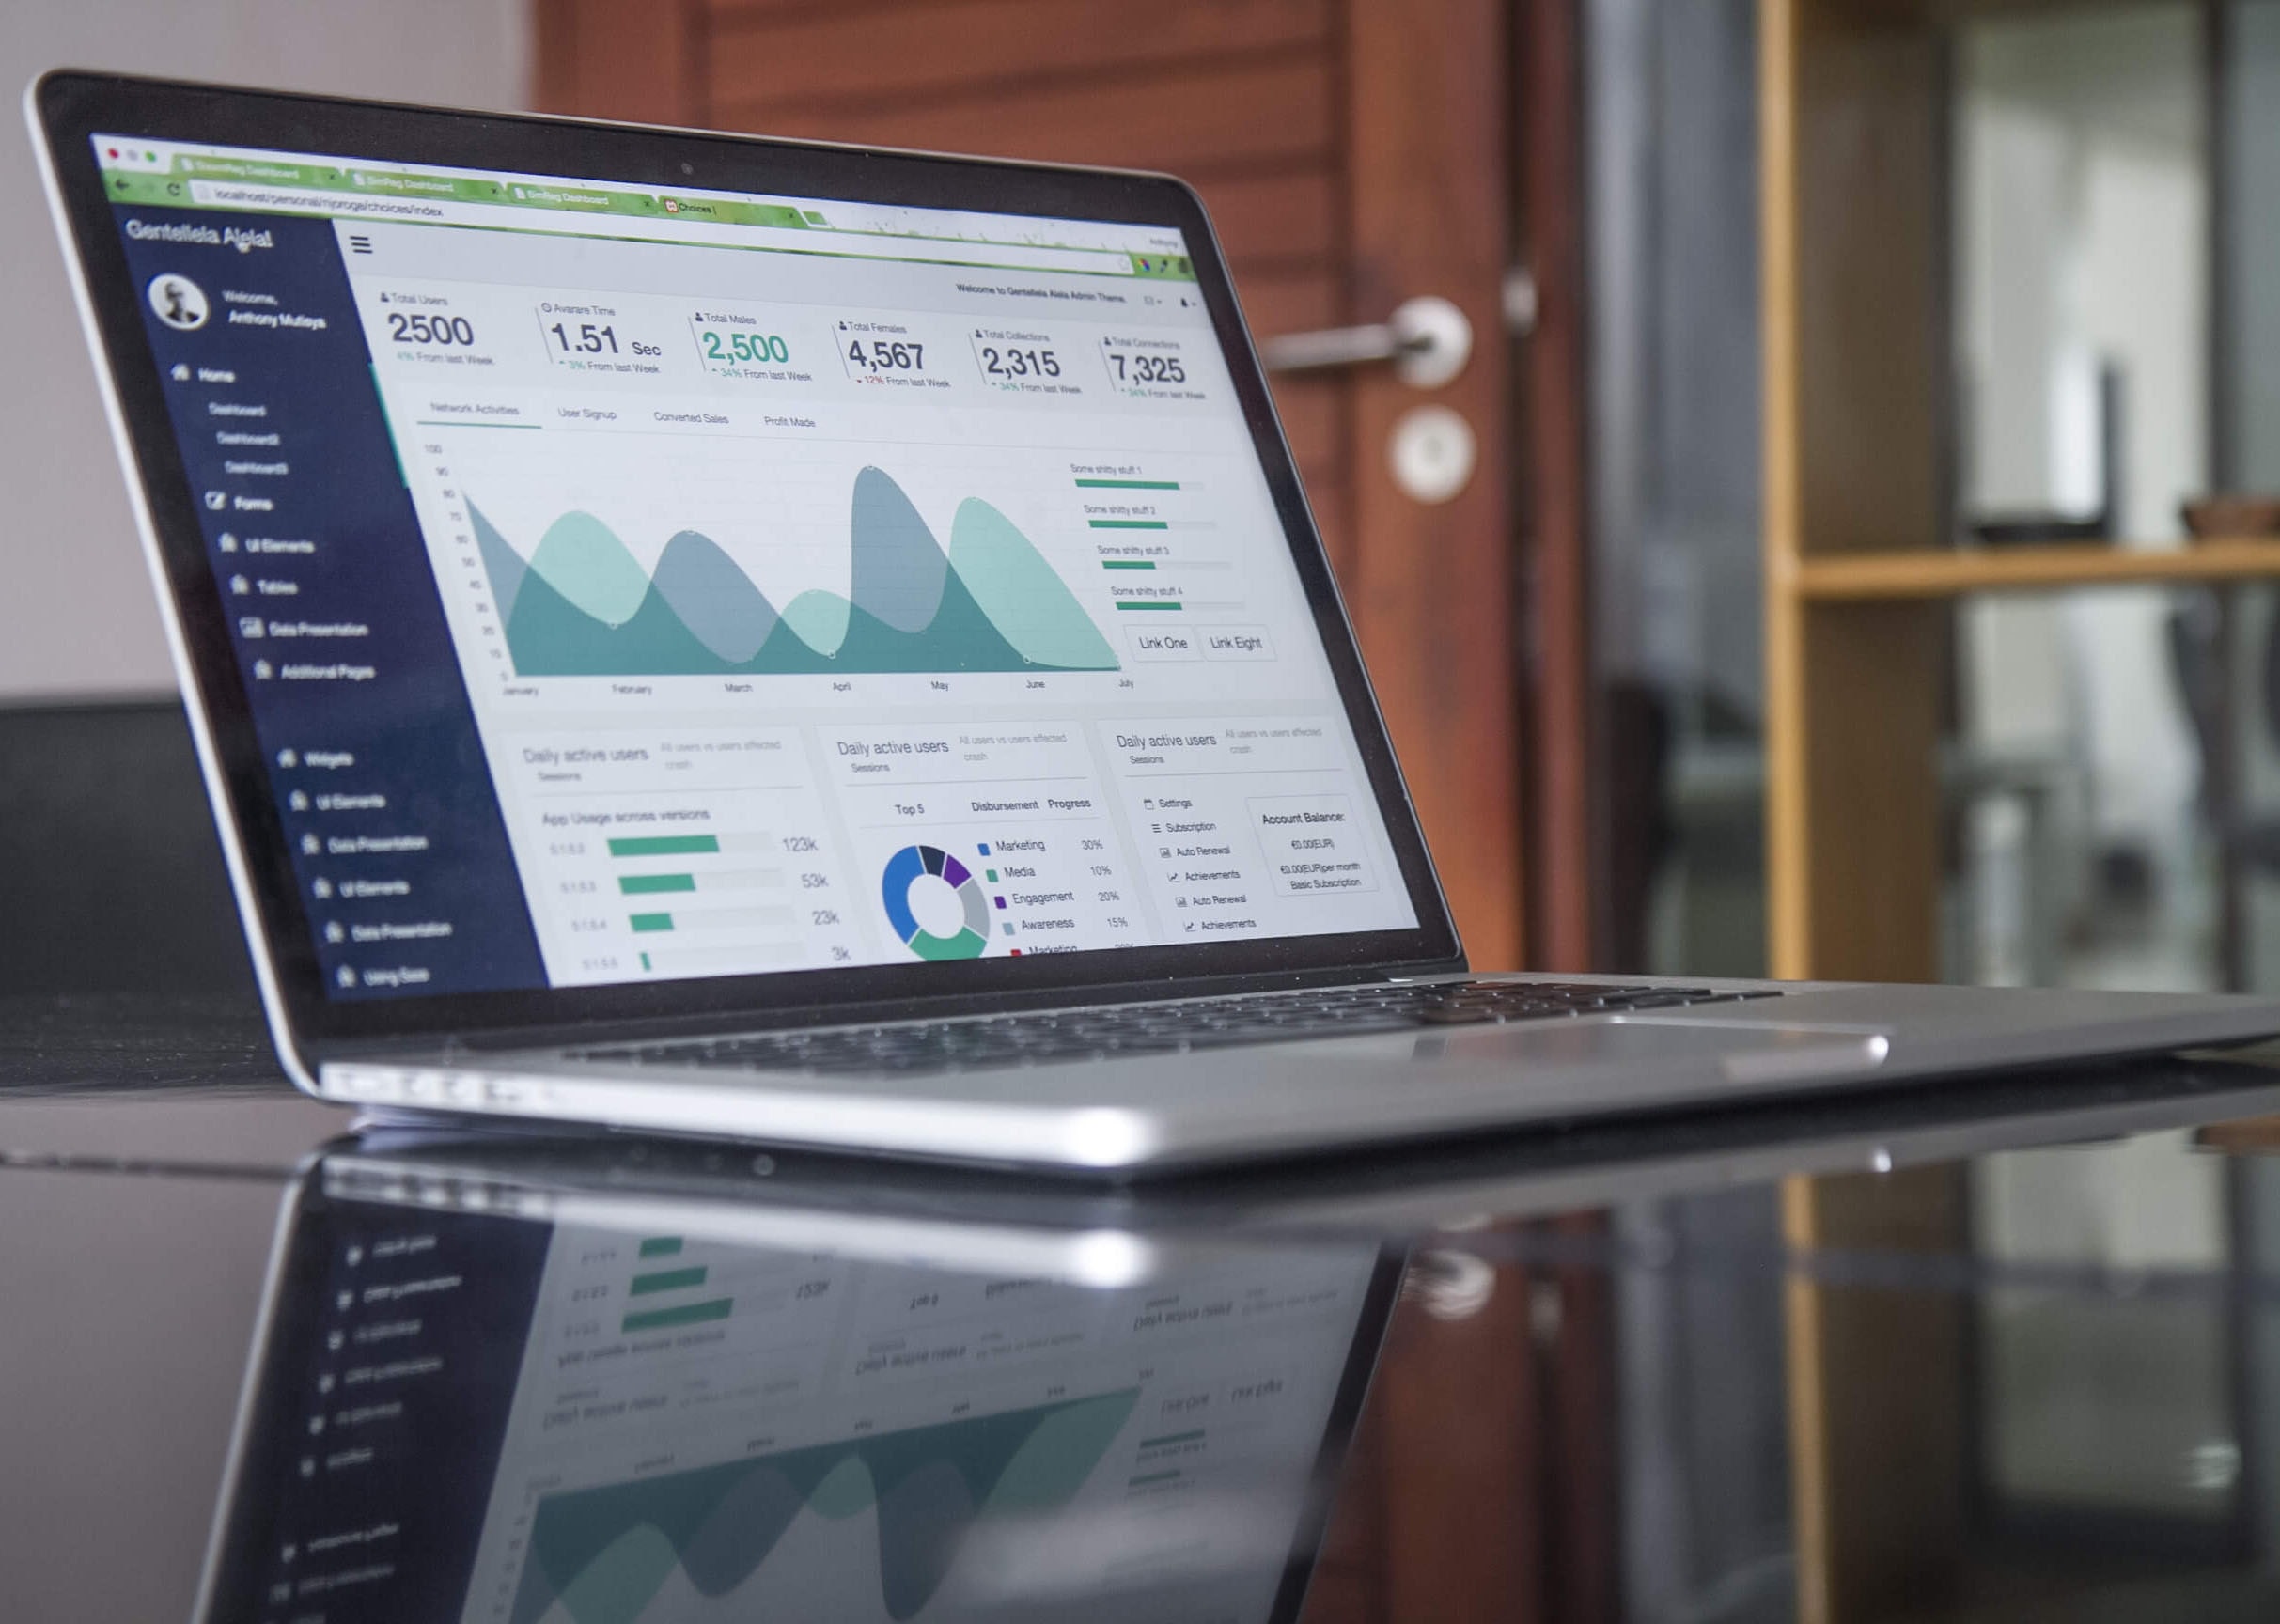
A data visualisation dashboard that allows users to manipulate and visualise textual and visual datasets without having to go into coding. This project will include several stages of a data analysis pipeline: preprocessing, feature extraction, dimensionality reduction and feature projection, data exploration, and clustering.

Goal
The main goal of this project is to create an interactive dashboard for visualising textual and visual data. The initial focus will be on textual data, which will then be extended to allow the user to input image datasets. The user will be able to: upload a dataset, which will be preprocessed and stored in a local database; choose among several feature extraction, dimensionality reduction and visualisation methods; filter the database based on its variables; and manipulate the visualisation.
Current State
I am just starting to work on this project. I will add a description of the features that are implemented to this section as I work on them.
(Expected) Dependencies
- Bokeh or Plotly (TBD)
- Pandas
- Scikit-learn
- Tensorflow
- Spacy
- Docker
- Postgres

Leave a comment